Motivated Seller Leads in Florida (2026): Contract Rates, Assignment Fees and Top Counties
Florida had the highest foreclosure rate of any state in the first half of 2026. ATTOM’s Mid-Year 2026 U.S. Foreclosure Market Report counted 27,494 Florida properties with a filing, about 1 in every 373 homes and roughly 1.7 times the national rate.
Most wholesalers read that as “more distress, more deals.” The data is more specific. Distress is concentrated in five counties, home prices in those counties are well below the state median, and that changes which motivated seller leads in Florida are actually profitable.
This report covers contract costs, assignment fee math by metro, and where Florida seller distress is heaviest going into 2027.
Florida is the only state where three things are happening at once: distress is rising, the resale market is cooling, and condo inventory is piling up.
Here’s the picture as of Q3 2026:
That last number matters more than it looks. A condo owner competing with 7.7 months of inventory, paying rising association costs, and facing a slow retail sale has a real constraint. Real constraints are what create discounted contracts.
Florida’s resale market is flat, distress is climbing, and sellers have fewer easy exits than they did a year ago.
The heaviest distress in Florida isn’t in Miami or Orlando. It’s in mid-priced Gulf Coast and Central Florida markets. Prices there are lower, insurance and storm costs hit harder, and owners have less equity to fall back on.
ATTOM’s Mid-Year 2026 report ranked metros of 200,000+ people by the share of housing units with a foreclosure filing. Five of the worst in the country were in Florida.
| Rank | County (Metro) | H1 2026 Foreclosure Rate | Median Listing Price |
|---|---|---|---|
| 1 | Charlotte (Punta Gorda) | 0.50% of housing units, worst in the U.S. | $369,972 (July 2026) |
| 2 | Polk (Lakeland-Winter Haven) | 0.48% of housing units | $329,000 (Aug 2026) |
| 3 | Lee (Cape Coral-Fort Myers) | 0.35% of housing units | $379,900 (Sept 2026) |
| 4 | Duval and Northeast Florida (Jacksonville) | 0.31% of housing units | About 10% below the U.S. median (Aug 2026) |
| 5 | Marion (Ocala) | 0.31% of housing units | $299,900 (Sept 2026) |
Foreclosure rates: ATTOM Mid-Year 2026 U.S. Foreclosure Market Report. Listing prices: Realtor.com data via the Federal Reserve Bank of St. Louis (FRED).
Punta Gorda had the highest foreclosure rate of any metro its size in the country. About half a percent of all its housing units received a filing in six months. For a wholesaler, that means a market where pre-foreclosure and storm-damaged properties overlap heavily.
Lakeland-Winter Haven had the worst rate among metros of 500,000+ people, at about 1 in 421 housing units, according to Business Observer’s coverage of ATTOM’s data. Its median listing price also fell from $339,900 in August 2025 to $329,000 in August 2026. Sellers there are dealing with both distress and softening values.
Cape Coral’s median listing price fell 5%, from $399,900 in September 2025 to $379,900 in September 2026. Falling list prices push more owners into failed listings. A failed listing is one of the most reliable motivation signals in the business.
Duval County foreclosure filings rose nearly 47% year over year, according to a June 2026 Jacksonville Business Journal report citing ATTOM. Jacksonville’s median listing price is about 10% below the national median, which keeps prices accessible for end buyers.
Ocala’s median listing price was $299,900 in September 2026, flat from a year earlier and the lowest of the five counties. Low prices mean smaller assignment fees per deal. They also mean more cash buyers who can close without financing.
The pattern across all five is the same: distress is highest where prices are lowest, and that’s exactly where lead cost per contract matters most.
A contract rate only means something when you tie it to cost. The clearest measure is cost per signed contract: total lead spend divided by contracts signed.
iSpeedToLead tracks this across the whole marketplace. These are platform-wide figures for the last 12 months, not Florida-only numbers:
Here’s how one of the most-followed wholesaling educators frames the benchmark:
“From an investment perspective, how often would you spend $4,500 to make $15,000 over and over again? In 2025, anytime you can be under $5,000 in cost per contract, you are way ahead of the game.”
Jerry Norton, Flipping Mastery
He’s also said that in competitive markets like Phoenix, marketing cost per contract can reach $12,000 or more. Against that benchmark, a $1,500 to $2,300 average is strong. The $6,900 Exclusive figure needs a bigger spread to justify it.
Cost per contract, not cost per lead, decides whether a Florida market is profitable for you.
There’s no reliable public dataset of Florida assignment fees, so this section models them. The method is shown so you can plug in your own numbers.
The assumptions (illustrative, not observed data):
| Metro | Median Listing Price (ARV proxy) | Modeled Assignment Fee (5% of ARV) | Fee vs. $1,500 Member Cost per Contract | Fee vs. $6,900 Exclusive Cost per Contract |
|---|---|---|---|---|
| Ocala | $299,900 | ~$15,000 | ~10x | ~2.2x |
| Lakeland-Winter Haven | $329,000 | ~$16,450 | ~11x | ~2.4x |
| Punta Gorda | $369,972 | ~$18,500 | ~12x | ~2.7x |
| Cape Coral-Fort Myers | $379,900 | ~$19,000 | ~13x | ~2.8x |
| Florida statewide (median sale) | $415,000 | ~$20,750 | ~14x | ~3.0x |
Two things stand out:
Your assignment fee comes out of your end buyer’s profit, and that profit is shrinking.
ATTOM’s Q2 2026 U.S. Home Flipping Report put typical gross flipping profit at $60,526, down from $71,000 a year earlier. Profit margins fell from 27.6% to 21.5%. When flippers earn less, they pay less, and wholesalers who still price contracts on 2024 spreads will have trouble assigning them.
Modeled numbers are useful. Closed deals are better.
Austin Fry, an iSpeedToLead buyer, made $27,750 on the first lead he ever bought, closing it on one call. He also locked up an owner-finance deal for his own portfolio in St. Petersburg, Florida, and had two more Florida contracts pending at the time.
“Thanks to ISTL we dominate our area. $300k last 12 months.”
Nick T., Florida investor
Both stories make the same point: Florida rewards investors who stay consistent in one defined market instead of chasing one-off deals across the state.
Choose your lead tier based on your county’s price point, not on a general preference for exclusivity. iSpeedToLead sorts every lead into tiers by freshness and by how many buyers can purchase it.
Here’s how that applies to Florida’s distress counties:
Every lead also shows a DealPredictor AI score before you buy. That lets you save your Exclusive budget for the sellers with the strongest signals.
The right tier in Florida is the one that keeps your fee at least a few times larger than your cost per contract.
Condo owners are the most overlooked motivated seller group in Florida right now, and the supply data shows why.
Florida’s condo-townhouse market had 7.7 months of supply in Q3 2026, compared with 4.4 months for single-family homes, according to Florida Realtors. The condo median price was $295,000, flat year over year, while single-family prices rose 2.4%.
What’s driving it:
There’s a catch. Many Florida condo associations require buyer approval, which can slow down or complicate an assignment. Confirm the association’s approval process before you sign the seller, or plan to double close instead.
Florida condo leads are highly motivated, but they reward investors who know the paperwork.
Florida forecloses through the courts, so the process is slower than in non-judicial states. That gives you time.
ATTOM reported that homes foreclosed nationally in Q2 2026 spent an average of 563 days in the process, the shortest since 2013. Even at that pace, a Florida owner who receives a filing has many months to sell before an auction.
What this means in practice:
In Florida, patience is a structural advantage built into the state’s foreclosure process.
The data points to a clear plan for investors buying motivated seller leads in Florida over the next 12 months.
iSpeedToLead’s take: Florida’s 2026 opportunity isn’t in the headline markets. It’s in mid-priced distress counties like Polk and Charlotte. Investors there who keep cost per contract under $2,500 will out-earn investors paying for exclusivity in Miami. Expect foreclosure filings to stay elevated through 2027 as insurance and association costs keep pressuring owners, though storm seasons and interest rate changes could shift the timing.
There’s a real downside too. Low-priced counties leave less room for error, so a few bad purchases can erase a month’s margin. That’s why the team at iSpeedToLead recommends tracking your own cost per contract every week instead of judging a market by one deal.
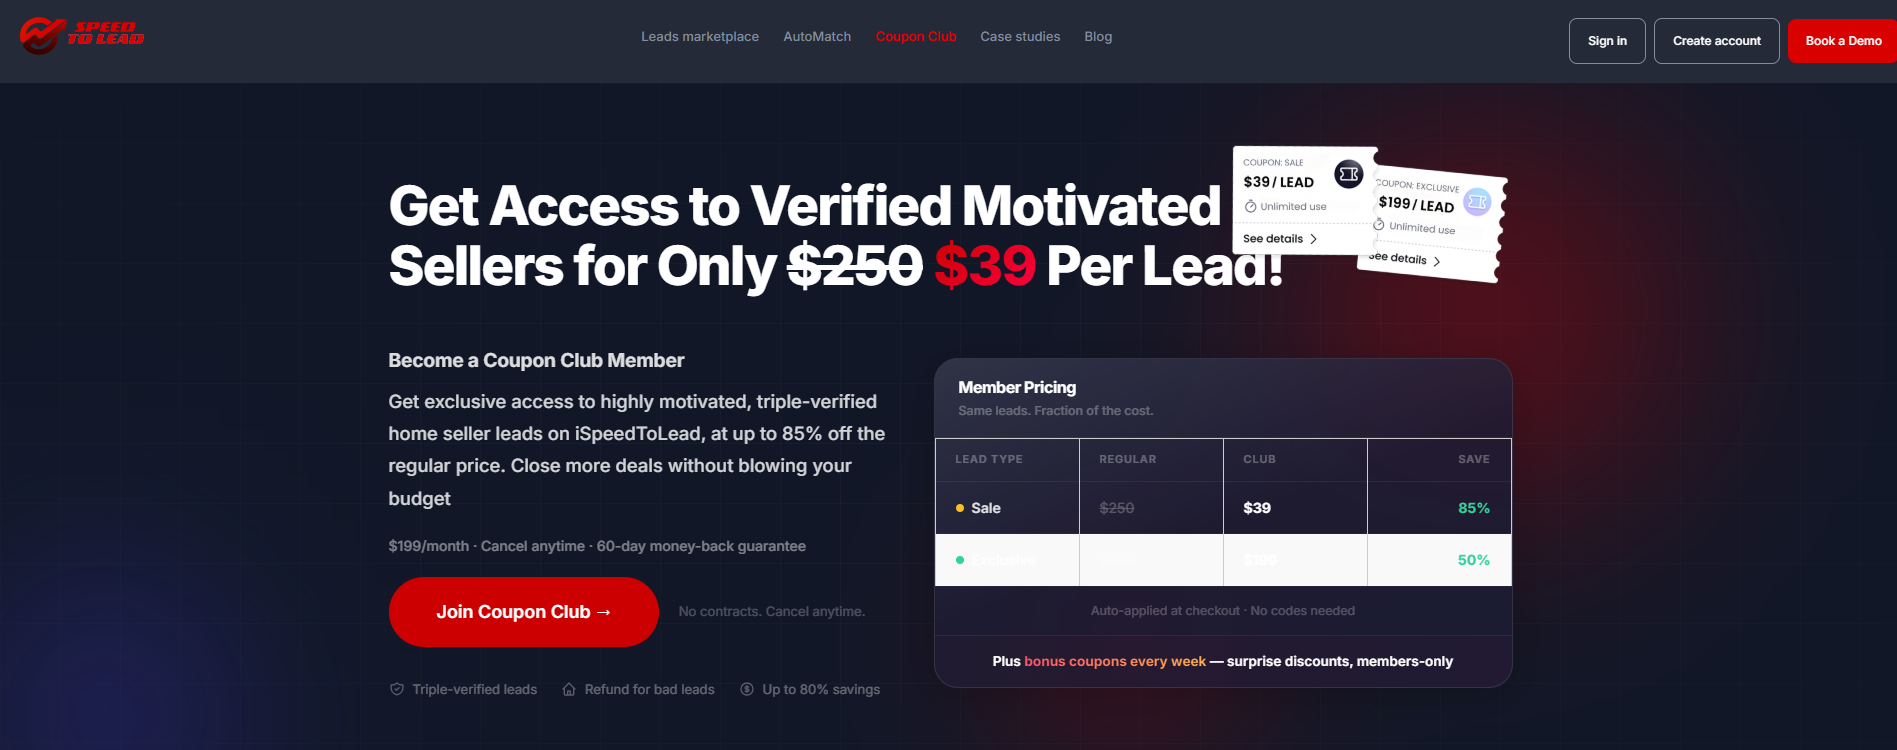
iSpeedToLead is the largest motivated seller leads marketplace in the US. More than 16,000 investors have bought leads on the platform, and buyers sign more than 1,000 contracts every month. That scale is what makes it possible to measure cost-per-contract benchmarks like $1,500 for members and $2,300 overall.
Florida’s 2026 data tells a simple story. Distress is rising fastest in lower-priced counties, end-buyer margins are shrinking, and the investors who win match their lead cost to local deal size.
New buyers can enter code GET90 on the checkout payment page for 90% off their first lead on the best motivated seller lead marketplace.
Book a demo with iSpeedToLead to see live lead inventory and pricing in your target Florida counties.
Read Next:
The Florida county with the most motivated sellers in 2026, measured by foreclosure rate, is Charlotte County. Its Punta Gorda metro had the highest rate of any U.S. metro its size in the first half of the year, and Polk County (Lakeland-Winter Haven) was a close second at 0.48% of housing units.
A signed contract costs about $2,300 on average when buying motivated seller leads on iSpeedToLead, based on platform-wide data from the last 12 months. Members average about $1,500 per signed contract, and Exclusive lead buyers average about $6,900.
A typical assignment fee in Florida in 2026 depends heavily on the county’s price point, and no reliable public dataset tracks it. Using a spread of 5% of ARV, modeled fees range from about $15,000 in Ocala to about $20,750 at the statewide median sale price of $415,000.
Exclusive leads can be worth it in Florida’s lower-priced counties, but only for sellers with strong deadline signals. In Ocala and Lakeland, a modeled fee of $15,000 to $16,450 covers the $6,900 Exclusive cost per contract only about 2.2 to 2.4 times, compared with about 10 to 11 times at member pricing.
You can start buying motivated seller leads in Florida by browsing LeadFeed with no membership, or by setting county filters and a budget in AutoMatch to receive Exclusive leads starting at $150. New buyers can enter code GET90 at checkout for 90% off their first lead.
October 28, 2026
October 26, 2026
October 23, 2026
October 21, 2026
October 19, 2026
October 15, 2026
October 14, 2026
October 12, 2026
October 10, 2026
Select the type of leads you're interested in.

