Motivated Seller Lead Volume by State: 2025 vs. 2026 Trends

This report covers motivated seller lead activity across all 50 U.S. states and the District of Columbia. The primary analysis compares full-year 2025 baseline figures against Q1 2026 actual data, with early trend signals tracked through May 2026. Analysis is structured at three levels: national, U.S. Census regional (Northeast, Midwest, South, West), and individual state.
The primary proxy for motivated seller lead volume is ATTOM Data Solutions foreclosure filings, comprising default notices, scheduled auctions, and bank-owned (REO) properties. Foreclosure activity is the most reliable, publicly verifiable indicator of distressed and motivated seller conditions that feed lead generation pipelines. No public dataset aggregates direct motivated seller lead purchase volumes by state for 2025–2026; foreclosure filings serve as the strongest available proxy.
Secondary data includes FSBO listing volumes as a high-motivation seller segment. Supplemental context draws from the Bureau of Labor Statistics (unemployment), Goliath Data (life-event seller motivations), and iSpeedToLead internal insights drawn from 74,000+ tracked leads across a 19-month dataset.
iSpeedToLead’s analysis of national motivated seller activity confirms one of the most significant lead volume expansions in recent memory. The full-year 2025 baseline recorded 367,460 properties with foreclosure filings, itself a 14% increase over the prior year, establishing an already-elevated floor entering 2026.
Q1 2026 then accelerated that trajectory further, producing 118,727 filings in a single quarter, a 26.37% year-over-year increase. March 2026 alone recorded 45,921 filings, up 28% from the prior March.
If the Q1 2026 pace holds, 2026 is on track to produce between 474,000 and 500,000 total national filings, a 29–36% increase over the full-year 2025 baseline.
The five most significant state-level signals entering 2026:
Primary drivers include post-pandemic housing market normalization and the equity reset underway in previously overheated markets, rising homeownership costs (insurance, property taxes, and maintenance up an estimated 17% since 2022), life-event-driven seller urgency accounting for over 40% of motivated seller contacts, and sustained mortgage rate pressure averaging 6.66% throughout 2025.
Strategic implication: The investors and platforms best positioned for 2026 are those with allocation already concentrated in the South and Midwest, where distress is growing fastest, while holding a secondary eye on Sun Belt markets where equity-rich sellers are growing increasingly motivated by stagnant days on market and rising carrying costs.

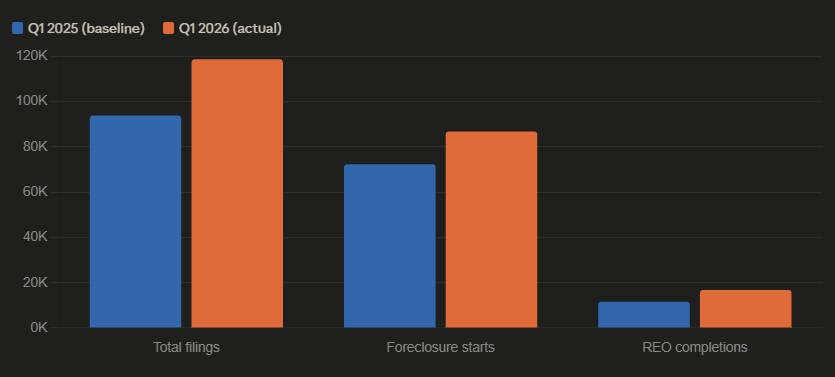
The full-year 2025 baseline reflects 367,460 properties with at least one foreclosure filing. Foreclosure starts totaled 289,441, the front-line indicator of new distress events entering the pipeline. REO completions totaled 46,439, reflecting properties that completed the full foreclosure cycle and entered the market as direct acquisition opportunities.
The national foreclosure rate for 2025 was 0.26% of all housing units, approximately 1 in every 385 units, elevated relative to the pandemic-suppressed years, but still below pre-2008 crisis levels.
Q1 2026 produced 118,727 total foreclosure filings. Foreclosure starts for the quarter ran approximately 20% above Q1 2025 levels. REO completions ran approximately 45% above Q1 2025, indicating that properties initiated into distress in 2024–2025 are now completing the full foreclosure cycle and converting into active acquisition opportunities.
March 2026 recorded 45,921 filings, the quarter’s single-month peak and a 28% year-over-year increase. At the Q1 2026 annualized pace, full-year national filings will land between 474,000 and 500,000, a 29–36% increase over the 2025 baseline.
| Metric | 2025 Full Year | 2026 Q1 Actual | YoY Change |
|---|---|---|---|
| Total Filings | 367,460 | 118,727 (Q1) | +26.37% (Q1 vs. Q1) |
| Foreclosure Starts | 289,441 | Tracking ~20% above Q1 2025 | +20% (Q1 trend) |
| REO Completions | 46,439 | Tracking ~45% above Q1 2025 | +45% (Q1 trend) |
| National Rate | 1 in ~385 units | Accelerating | Worsening |
| Single-Month Peak | — | 45,921 (March 2026) | +28% vs. March 2025 |
Q1 2026 filings rose 6.3% from Q4 2025, confirming the acceleration was not seasonal noise. March’s volume spike is consistent with post-holiday foreclosure processing cycles, but the magnitude of the year-over-year comparison points to structural normalization, not a processing backlog or policy-driven anomaly.
The trend reflects a sustained increase in distressed seller activity as pandemic-era forbearance tailwinds fully exhaust and homeownership costs continue to rise at rates that outpace income growth in key markets.

High-volume Northeast states like New York and Pennsylvania are accelerating, driven by long judicial foreclosure timelines that are now clearing backlogs from 2022–2024 initiation cycles. Smaller Northeast states are contracting, reflecting high home equity levels, stable employment, and limited life-event-driven distress relative to the South.
For motivated seller lead generation, New York, New Jersey, and Pennsylvania remain viable Northeast targets. Connecticut and Rhode Island are deprioritization candidates for 2026 budget allocation.
The Midwest is one of the most consistent and reliable lead opportunity regions in 2026. Indiana holds the single worst foreclosure rate in the country and continues to accelerate.
Ohio’s 33% Q1 increase reflects rising code violation filings, tax delinquency pressure, and aging housing stock challenges across its secondary markets. Illinois maintains top-five distress rate status despite modest percentage growth, its baseline was already elevated.
The Indiana–Ohio–Illinois corridor represents a high-density Midwest lead opportunity cluster with no signs of cooling.
The South is the dominant region for motivated seller lead volume and growth in 2026, by a significant margin.
Florida leads in absolute volume and continues to accelerate.
Texas maintains its position as a volume leader with steady 23% growth.
Georgia and North Carolina are the region’s highest-growth markets by percentage, signaling strong emerging pipeline for investors not yet heavily allocated there.
South Carolina sustains one of the nation’s worst foreclosure rates, making it a consistent, reliable distressed lead target.
The South should represent the majority of 2026 lead acquisition investment for any nationally scaled operation.
The West presents a bifurcated picture. California and Arizona are high-volume, steady-growth markets where inventory stabilization and price pressure are beginning to motivate equity-rich sellers to consider off-market solutions. Colorado’s 74% percentage jump is the West’s most significant emerging signal, reflecting rapid normalization in a market that was among the nation’s most overheated during 2021–2022.
Idaho showed similar dynamics at approximately 76% YoY growth, though at lower absolute volumes. Nevada sits in stable territory at +4.68%, a hold rather than a growth allocation target for 2026.

| State | Region | 2026 Q1 Filings | YoY Change | Trend |
|---|---|---|---|---|
| Florida | South | 13,683 | +43.67% | ↑ Strong |
| California | West | 12,318 | +15.11% | ↑ Moderate |
| Texas | South | 11,568 | +23.67% | ↑ |
| New York | Northeast | 6,582 | +32.92% | ↑ |
| Illinois | Midwest | 6,551 | +3.08% | ↑ Slight |
| Ohio | Midwest | 5,499 | +33.00% | ↑ Strong |
| Pennsylvania | Northeast | 4,244 | +19.92% | ↑ |
| Georgia | South | 4,549 | +77.83% | ↑ Explosive |
| North Carolina | South | 4,141 | +55.79% | ↑ Strong |
| Indiana | Midwest | 4,028 | +33.16% | ↑ Strong |
| South Carolina | South | 3,288 | +39.74% | ↑ Strong |
| Arizona | West | 2,807 | +31.05% | ↑ |
| Colorado | West | — | +74.04% | ↑ Explosive |
| Idaho | West | — | +75.69% | ↑ Explosive |
| Arkansas | South | — | +65.27% | ↑ Strong |
| Missouri | Midwest | — | +48.89% | ↑ Strong |
| Alabama | South | — | +38.71% | ↑ Strong |
| Nevada | West | — | +4.68% | → Stable |
| Delaware | South | — | +1.83% | → Stable |
| Hawaii | West | — | 0.00% | → Flat |
| Connecticut | Northeast | — | -27.57% | ↓ Declining |
| Rhode Island | Northeast | — | -22.11% | ↓ Declining |
| Oklahoma | South | — | -17.28% | ↓ Declining |
| Maine | Northeast | — | -15.47% | ↓ Declining |
| Oregon | West | — | -9.62% | ↓ Slight |
States marked “—” for Q1 filing volume have directional trend data confirmed from ATTOM Q1 2026 reports. Absolute volume figures for these states are available at the county level from ATTOM source reports.
| Rank | State | Region | YoY Growth |
|---|---|---|---|
| 1 | Georgia | South | +77.83% |
| 2 | Idaho | West | +75.69% |
| 3 | Colorado | West | +74.04% |
| 4 | Arkansas | South | +65.27% |
| 5 | North Carolina | South | +55.79% |
| 6 | Missouri | Midwest | +48.89% |
| 7 | Florida | South | +43.67% |
| 8 | South Carolina | South | +39.74% |
| 9 | Alabama | South | +38.71% |
| 10 | Indiana | Midwest | +33.16% |
Eight of the top ten growth states are in the South or lower Midwest. Georgia and Colorado’s positions at the top of this list make both states priority emerging market targets, they are growing faster than markets that have historically received the most acquisition attention.
| State | Region | YoY Change |
|---|---|---|
| Connecticut | Northeast | -27.57% |
| Rhode Island | Northeast | -22.11% |
| Oklahoma | South | -17.28% |
| Maine | Northeast | -15.47% |
| Oregon | West | -9.62% |
These states share a common profile: relatively high home equity levels, more stable labor markets, and limited migration-driven demand pressure. Declining filing volume translates directly to reduced inbound lead opportunity. These markets should be deprioritized in favor of high-growth alternatives.
These markets represent consistent, if unspectacular, lead environments where existing allocation can be maintained without aggressive scaling or significant reduction.
Florida remains the single most important state for motivated seller lead volume in 2026. Its 13,683 Q1 filings lead the nation in absolute terms, and the 43.67% YoY increase confirms the pipeline is not just large, it is actively growing.
The drivers are structural: Florida homeowners are absorbing some of the sharpest insurance cost increases in the country, compounding property tax pressures that followed the 2021–2023 valuation surge.
The combination of high carrying costs, rising unemployment in select metros, and competitive listing environments is producing a motivated seller cohort that spans from classic pre-foreclosure distress to equity-rich sellers willing to transact below market for speed and certainty.
As iSpeedToLead‘s lead data confirms, Florida consistently generates some of the highest-volume and highest-scoring distressed leads on the platform, and 2026 is accelerating that advantage.
Indiana and South Carolina represent the nation’s highest-rate distress markets, Indiana at 1 in 739 housing units, South Carolina consistently in the top five nationally. Both states are accelerating rather than stabilizing, and both have structural conditions, lower median incomes, aging housing stock, limited equity cushion in many sub-markets, that sustain elevated distress rates regardless of broader macro conditions.
For platforms building Midwest and Southeast pipelines, both states are reliable, high-volume targets for 2026 and beyond.
Texas is the volume leader when measured across the full year, with annual foreclosure starts historically exceeding 37,000. Q1 2026 showed a steady 23.67% increase, not explosive, but significant at Texas scale.
FSBO activity in Texas also runs at above-average national levels, creating a secondary motivated seller pipeline that supplements distress-based leads. Texas should be treated as a core, always-on allocation state for any nationally scaled program.
Investors who use iSpeedToLead to source Texas leads have access to both the distress pipeline and the FSBO segment within a single pre-scored, pre-verified marketplace, an efficiency advantage that compound across a market of this volume.
Georgia and Colorado are the two states that most warrant reallocation attention in 2026. Both posted growth above 74%, both from bases suggesting the trend is early-stage rather than mature.
Investors who established Georgia and Colorado positions in early 2026 are operating ahead of broader industry attention to these markets, and iSpeedToLead’s multi-state auto-buy capability (Fixed Price Mode) allows investors to capture that advantage without managing separate acquisition processes per state.

National unemployment averaged 4.3% across January through March 2026, stable at the national level but masking meaningful state-level variation. Fourteen states recorded year-over-year unemployment increases in Q1 2026.
Florida and Delaware both saw approximately 1 percentage point increases year-over-year, contributing directly to the distress conditions visible in their filing data. The most stable labor markets: South Dakota, Hawaii, North Dakota, hold unemployment around 2.3% and correspondingly lower distress filing volumes.
The macro picture is not crisis-level stress. It is the kind of sustained, uneven pressure that produces consistent motivated seller activity without the systemic shock that would freeze transaction markets, the ideal environment for disciplined lead acquisition programs.
National inventory rose approximately 8% year-over-year in early 2026. Median days on market are running in the 50–70 day range across most major markets, elevated relative to the 2020–2022 era.
The rate environment continues to suppress voluntary move-up transactions, keeping motivated seller leads as one of the few active and scalable acquisition segments in the current market.
The South continues to absorb the largest share of domestic migration, with North Carolina, Texas, South Carolina, and Florida leading inflow states. California, New York, and Illinois are the primary outflow states, partially explaining the more stable or declining filing trends in those markets despite high absolute volumes.
Baby Boomers account for approximately 45% of all home sales nationally. Life-event-driven seller motivation: divorce (15% of motivated contacts), inheritance (13%), and relocation, accounts for more than 40% of motivated seller contacts in aggregate.
Pre-foreclosure activity grew 9% year-over-year in 2025, indicating the upstream pipeline for 2026 distress events was already building before Q1 2026 data was collected.
No major state-level legislative changes materially impacted foreclosure filing volumes in the 2025–2026 period. The dominant regulatory story is normalization: pandemic-era foreclosure moratoriums and forbearance programs have fully expired, and court processing backlogs that accumulated during the moratorium period are clearing, particularly in judicial foreclosure states like New York, New Jersey, and Illinois, where multi-year court processing timelines create sustained pipeline effects that continue releasing volume into 2026.
Understanding where volume exists is only half of the equation. What separates investors who capitalize on this environment from those who don’t is the ability to identify which leads within a high-volume market are actually worth pursuing.
iSpeedToLead’s internal data, covering 74,000+ tracked leads over 19 months, confirms that the top 19% of leads scored by DealPredictor‘s AI system account for approximately 40% of all confirmed wholesale outcomes on the platform.
As RJ Bates III, CEO of Titanium Investments, has noted: “The quality of the signal before you make contact determines everything about how that conversation goes.”
Direct mail, Facebook, and TikTok campaigns show particular effectiveness in secondary and tertiary markets where digital competition for motivated seller attention is lower, a relevant consideration for investors allocating to the high-growth emerging states where lead competition has not yet caught up to filing volume growth.
Based on the combined analysis of absolute volume, year-over-year growth, and distress rate severity, three market tiers are recommended for 2026 lead acquisition prioritization:
Florida, Texas, Georgia, South Carolina, North Carolina, Indiana, Ohio, Illinois. These eight states combine large absolute lead pools with confirmed upward filing trajectories.
For any platform or investor operating at scale, these states should constitute the core of 2026 state-level allocation, and for investors using iSpeedToLead’s Fixed Price Mode, the multi-state auto-buy capability allows up to five of these states to run simultaneously without manual lead-by-lead management.
Colorado, Idaho, Arkansas, Missouri, Alabama. These states post the highest percentage growth figures in the country. Absolute volumes are smaller than Tier 1, but trend lines indicate early-stage distress normalization cycles that will produce increasing lead volume through 2026 and into 2027.
Early allocation here captures opportunity before broader industry attention arrives.
California, New York, Pennsylvania, Arizona, Nevada. Large, consistent markets without explosive growth, suitable for sustained allocation without aggressive scaling. California and New York represent substantial absolute volume that justifies presence, even at moderate YoY growth rates.
Connecticut, Rhode Island, Oklahoma, Maine, and Oregon are all posting year-over-year filing declines as of Q1 2026. These markets share high equity environments, stable labor markets, and limited migration pressure, conditions that suppress distress-driven motivated seller activity.
Platforms or investors with existing allocation in these states should evaluate whether current spend is producing results that justify the opportunity cost relative to the Tier 1 and Tier 2 markets above.
For a nationally scaled motivated seller lead acquisition program, the data in this report supports the following allocation framework:

To access motivated seller leads across any combination of these states: pre-scored, pre-verified, with a 21-day refund policy, visit iSpeedToLead. Use code GET90 at checkout to receive 90% off your first lead and evaluate the platform against your current acquisition cost before committing further budget.
The primary analytical limitation is proxy-based methodology: foreclosure filings measure distress conditions that feed motivated seller lead pipelines, but not every motivated seller is in foreclosure, and not every filing converts to an actionable contact.
FSBO and life-event-driven segments are underrepresented due to the absence of publicly aggregated state-level data. Directional conclusions carry high confidence. Absolute volume projections for full-year 2026 carry moderate confidence, pending Q2 and Q3 actual data.
Macro risk scenarios, a significant rate increase, a recession-driven transaction freeze, or new state-level foreclosure moratorium legislation, could materially alter the trajectory of any market covered in this analysis.
The data in this report points in one clear direction: 2026 is not a year of isolated distress signals, it is a year of broad, structural expansion in motivated seller lead opportunity across the country. The national filing trajectory, the regional concentration of growth in the South and Midwest, and the emergence of new high-growth markets in Georgia, Colorado, and Idaho are not coincidental.
They reflect the convergence of post-pandemic equity normalization, sustained high ownership costs, and the demographic reality of a large homeowning population navigating life events that don’t wait for favorable market conditions.
For real estate investors and wholesalers, the implication is straightforward: the lead pool is growing, and it will continue growing through 2026 and into 2027 as REO completions, currently running 45% above prior-year levels, convert into acquisition opportunities.
The question is not whether the leads are there. The question is whether your acquisition program is positioned to reach the right ones.
iSpeedToLead’s platform gives investors direct access to pre-verified, AI-scored motivated seller leads across 48 states, with DealPredictor scoring trained on 74,000+ tracked outcomes so that the leads most likely to convert are identified before you spend a dollar.
Book a demo with iSpeedToLead to see how the platform maps to the markets identified in this report and build a 2026 lead acquisition strategy grounded in the data, not guesswork.

June 23, 2026

June 22, 2026

June 21, 2026

June 20, 2026

June 19, 2026

June 18, 2026

June 17, 2026

June 16, 2026

June 15, 2026
Select the type of leads you're interested in.

